Download the database (.xls) – Download the entire Chartbook (.pdf)


Sources and References
Sources:
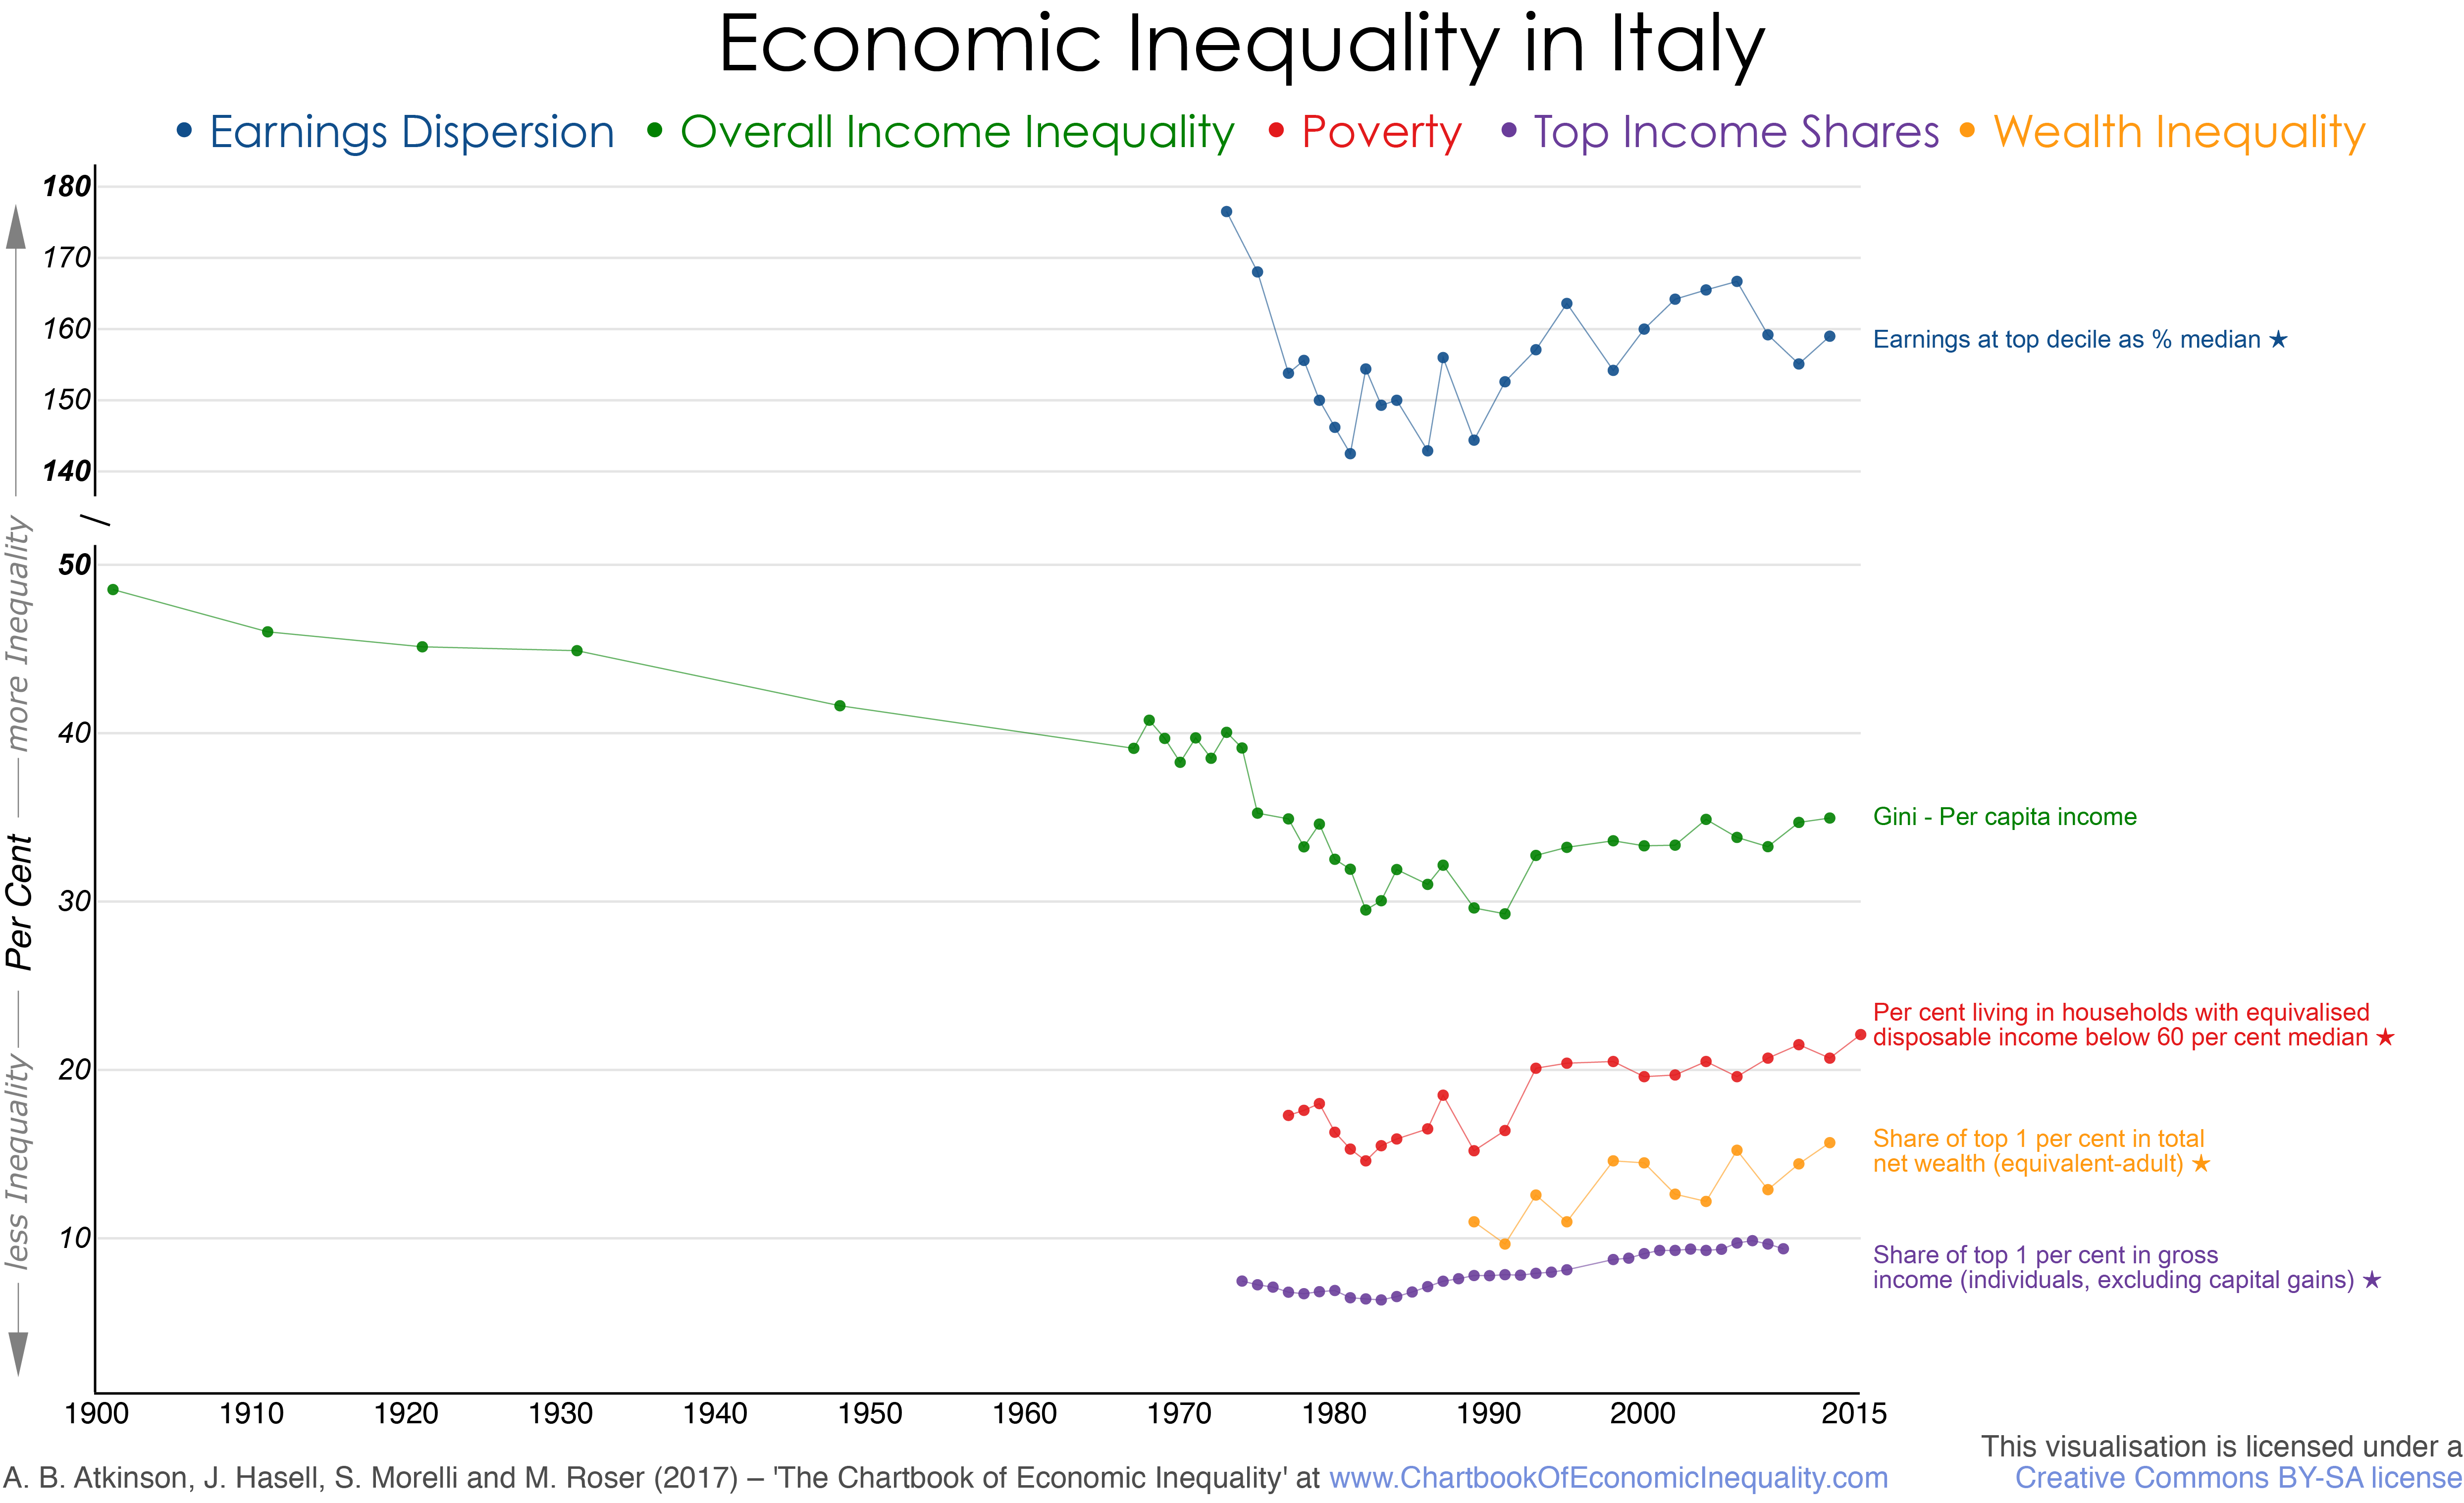
Overall inequality: Gini coefficient of per-capita income computed by N. Amendola, A. Brandolini and G. Vecchi and taken from Vecchi (forthcoming) based on work from Brandolini (1999) and Brandolini and Vecchi (2011) and Vecchi (2011); figures provided by Giovanni Vecchi; income is deflated using a spatial index of the cost of living at the regional level based on the work of Amendola, Kiswani and Vecchi (2009).
Top income shares: Share of top 1 per cent in total gross income (individuals, excluding capital gains) from WID.world, based on work of Alvaredo and Pisano (2010).
Poverty measures: Percentage of individuals in households with equivalised (modified OECD scale) disposable income below 60 per cent of the median from Bank of Italy, Statistics, Surveys of households and firms, Household Income and Wealth, Tables of main results (table B3A2).
Dispersion of earnings: From Atkinson (2008, Appendix K, Tables K.4 from 1977 on and K.5 up to 1975). Later figures provided by Andrea Brandolini.
Wealth inequality: Share of top 1 per cent in wealth (equivalent net wealth – modified OECD scale, person weights) from Brandolini et al (2004, Table 6, adjusted figures) and Brandolini (2014).
References:
- Alvaredo, F and Pisano, E, 2010, “Top incomes in Italy 1974-2004” in A B Atkinson and T Piketty, editors, Top incomes: A global perspective, Oxford University Press, Oxford.
- Amendola, N, Al Kiswani, B and Vecchi, G, 2009, “Il costo della vita al Nord e al Sud d’Italia, dal dopoguerra a oggi. Stime di prima generazione”, Rivista di Politica Economica, vol IV-VI, 3-34.
- Atkinson, A B, 2008, The changing distribution of earnings in OECD countries, Oxford University Press, Oxford.
- Brandolini, A, 1999, “The Distribution of Personal Income in Post-War Italy: Source Description, Data Quality, and the Time Pattern of Income Inequality”, Giornale degli Economisti e Annali di Economia, vol. 58, pp. 183-239.
- Brandolini, A, 2014, “The Big Chill. Italian Family Budgets after the Great Recession”. In C Fusaro and A Kreppel, editors, Still waiting for the transformation, Berghahn, New York.
- Brandolini, A and Vecchi, G, 2011, “The Well-Being of Italians: A Comparative Historical Approach”, Bank of Italy, Economic History Working Papers n. 19.
- Brandolini, A, Cannari, L, D’Alessio, G, and Faiella, I, 2004, “Household wealth distribution in Italy in the 1990s”, Bank of Italy, Economic Research Department.
- Vecchi, G, 2011, “In ricchezza e in povertà. Il benessere degli italiani dall’Unità a oggi”, Bologna: Il Mulino.
- Vecchi, G, (forthcoming) “A History of Living Standards in Italy, 1861-2011” Monograph for Oxford University Press.